How to Troubleshoot and Debug Webhooks Tutorial
In a previous article, we looked at the practice of debugging webhooks. We covered why it is important to debug our webhooks, why webhooks can be difficult to troubleshoot, how to know what to debug, and tools that can help make the troubleshooting process easier. In this post, we will put the theory of debugging webhooks into practice by receiving webhooks locally from a Stripe account and debugging them using the Hookdeck CLI.
By the end of this exercise, you will be well equipped to debug webhooks in your development workflows.
Tutorial
Setting up Stripe webhooks locally
In this tutorial, we will go through how to locally receive and debug Stripe webhooks. At the end of this guide, we will have a setup that receives Stripe webhooks locally and gives us visibility into the headers and payload of each webhook request.
Setting up Stripe webhooks
The first step in this exercise is to set up a Stripe account. Stripe is the webhook provider, so we will be subscribing to Stripe events and receiving webhooks on a local server.
At the time I am writing this, all you need to set up a Stripe account is your email address. If you already have a Stripe account, you can proceed to the next section but if not, head over to the Stripe registration page to set up a new account. You will be required to verify your email address after you register.
Cloning a Node.js API project
Next, we need a local server to receive webhooks from Stripe. You can use any local server of your choosing, written in your preferred language, as long as you ensure that it is running on a specific port. For this exercise, we will use a Node.js sample API available on the Hookdeck GitHub repository.
You can clone this repository by running the following command:
git clone <https://github.com/hookdeck/nodejs-webhook-server-example.git>
This will make the project available at the location where you ran the command on your file system.
Navigate to the root of the project and install the required dependencies by running the following commands:
cd nodejs-webhook-server-example
npm install
When the installation completes, you can then run the Node.js server with the following command:
npm start
This will boot up the API application and print a message to the screen indicating that the API is now running and listening for connections on port 1337.
The endpoint to be used for the webhook requests is /stripe-webhooks-endpoint and can be found in the routes.js file as shown below:
router.post(
  "/stripe-webhooks-endpoint",
  bodyParser.raw({ type: "application/json" }),
  function (req, res) {
    console.log(req.body);
    res.send("Stripe Successfully received Webhook request");
  },
);
This endpoint receives the webhook requests, prints the request body to the console, and returns a message.
Receiving webhooks on localhost
In order to debug webhooks locally, we need to be able to receive webhooks in our local environment. This is not possible out of the box as local running servers are not publicly available on the internet. Therefore, we will use the Hookdeck CLI because it is built specifically for debugging webhooks, as opposed to the others which have to be configured, and sometimes coupled with other tools, to work with webhooks.
You can also use our online webhook test tool if you prefer not to install a tool or don’t have the privileges to on the system you’re using to debug.
Set up Hookdeck CLI
Visit Hookdeck's CLI documentation to install and set up the tool on your operating system.
Once the setup process is complete, the next step is to use the CLI to generate a webhook URL that points to the running API application. To do this, run the following command:
hookdeck listen 1337
This command starts an interactive session where the CLI collects information about the endpoint you're about to create. Below are the questions and answers you should supply to each question. Ensure to hit the Enter key after each answer.
| Question | Answer |
|---|---|
| What source should you select? | Create new source |
| What should your new source label be? | stripe |
| What path should the webhooks be forwarded to (i.e.: /webhooks)? | /stripe-webhooks-endpoint |
| What's the connection label (i.e.: My API)? | My Stripe API |
With this information, the CLI will begin the process of generating the URL and once it's done, you will see the URL printed to the screen and the CLI indicating that it is ready to receive requests.
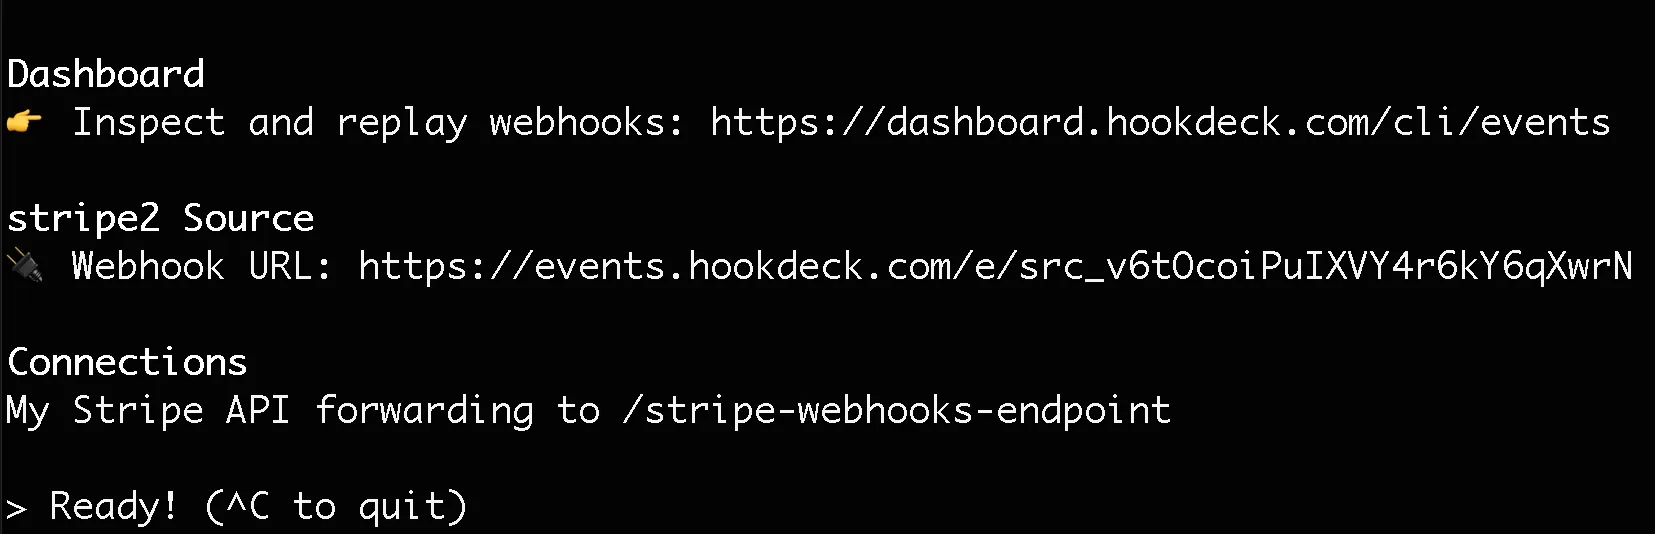
Copy the webhook URL, as it will be required for setting up webhooks on Stripe.
Register to Stripe webhook
Now that we have completed the setup on the destination application, it's time to subscribe for a webhook on Stripe.
On your Stripe dashboard, go to Developers → Webhooks. On the "Webhooks" page, click on the + Add endpoint button at the top right-hand side of the screen. This action will pop up a dialog similar to the one below:
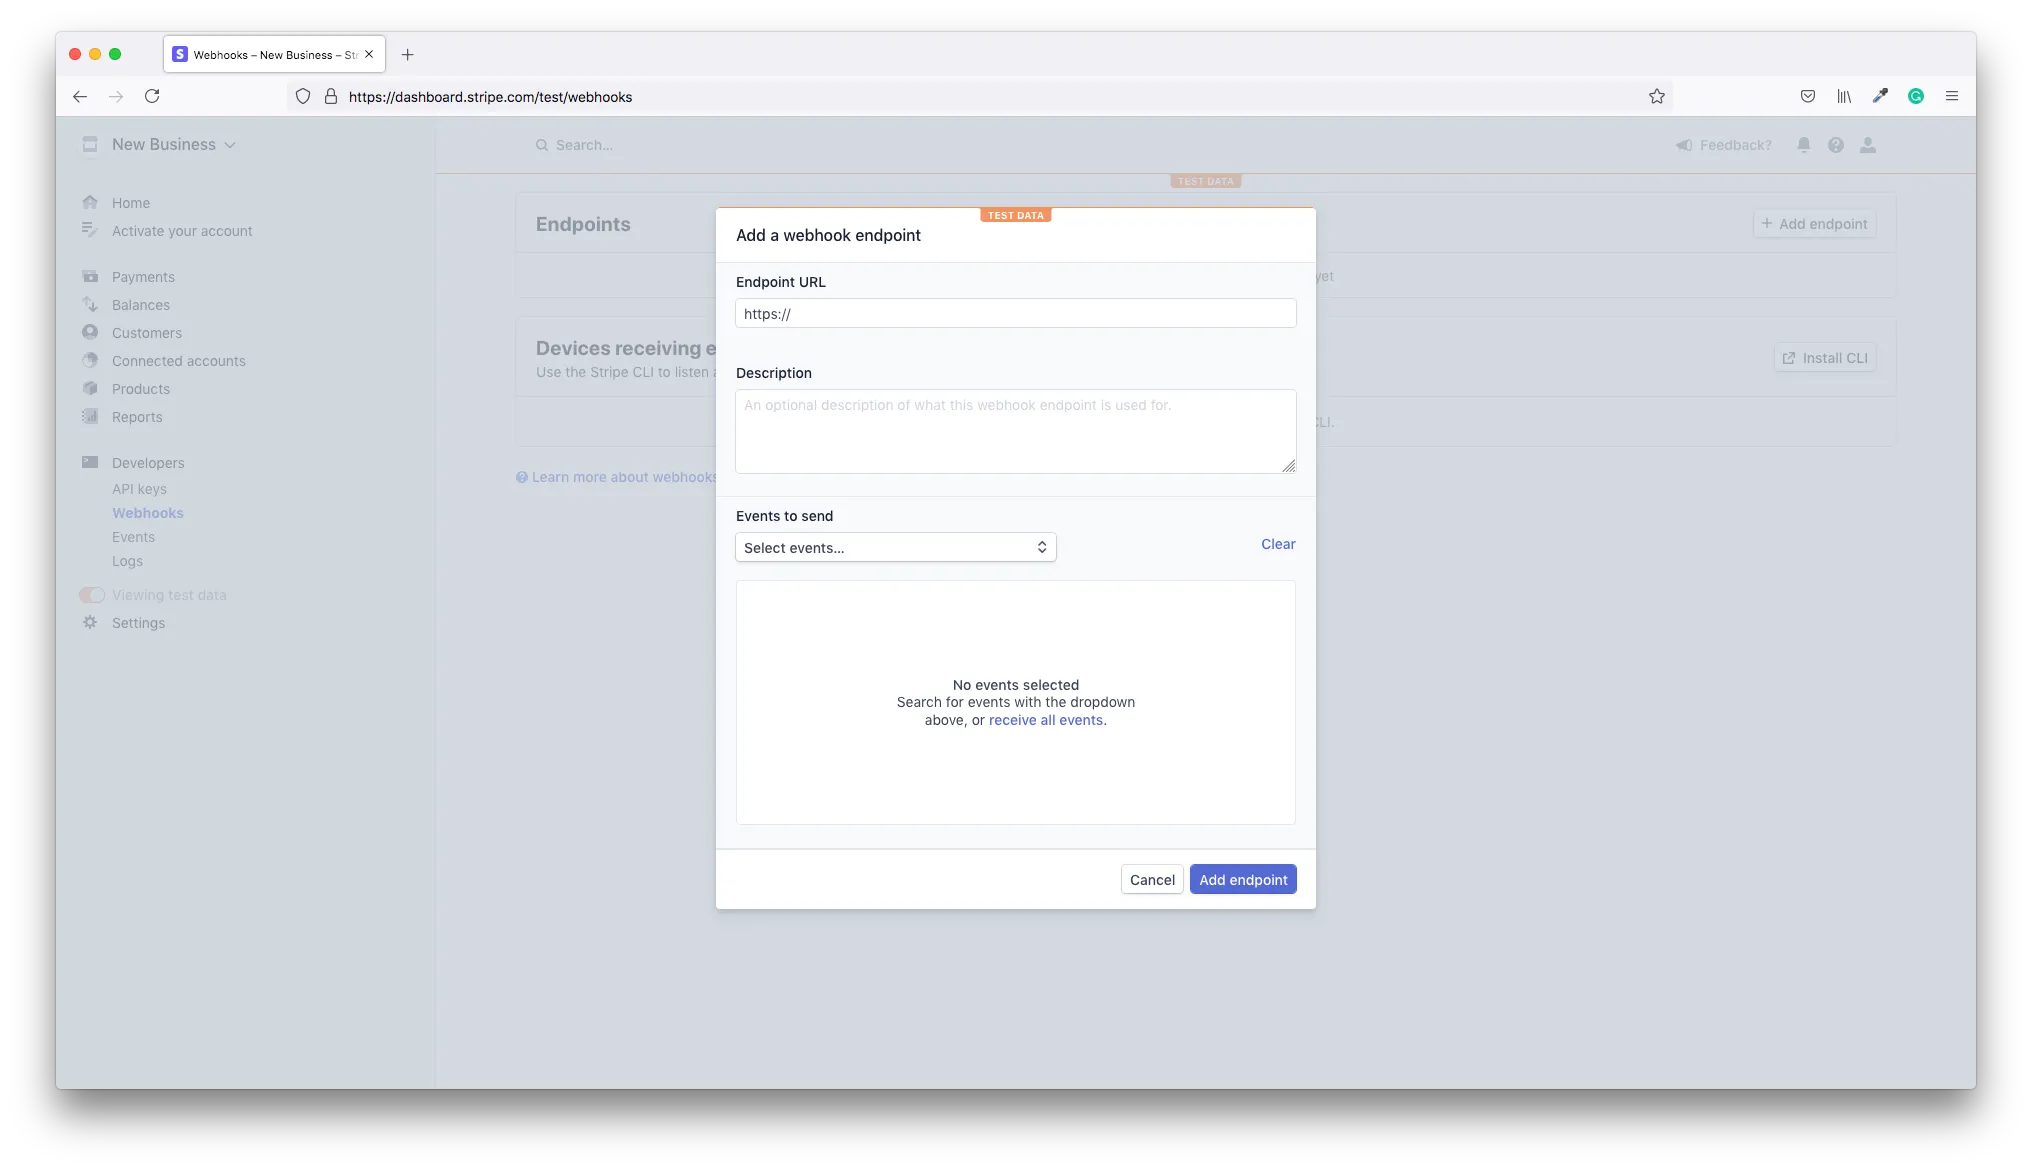
On the dialog, add the webhook URL copied from the CLI into the Endpoint URL field. Next, click the Events to send dropdown and select the account.updated event which will be triggered each time your Stripe account is updated. Click the Add endpoint button to complete this process.
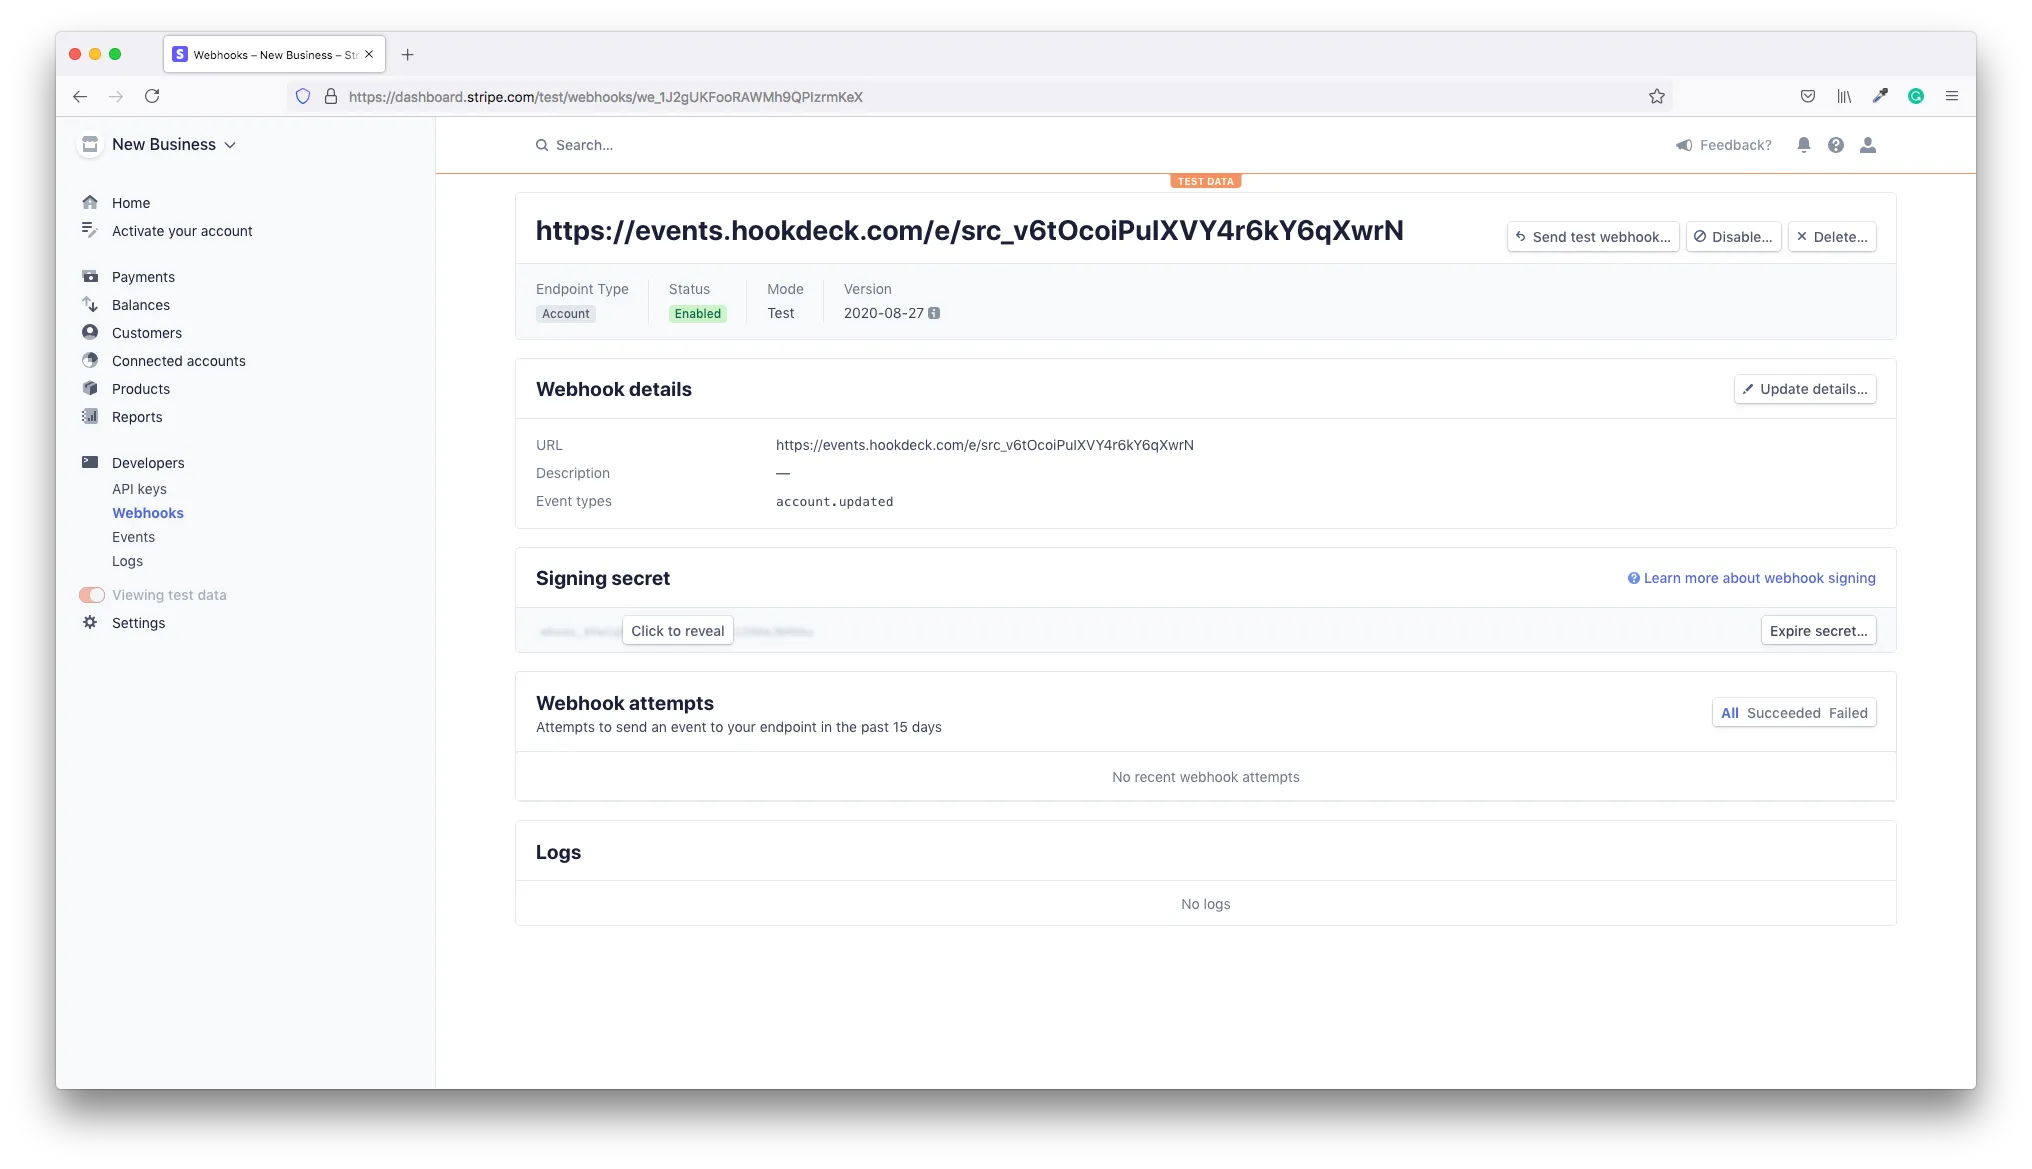
This will create the connection between your Stripe account and the API application running on your local machine for the account.updated event. After the webhook has been successfully added, you will see a screen like the one below:
Test Stripe webhook
With our webhook connection set up, it's now time to test it. Stripe provides a way to send a test webhook that simulates the event you have registered for. This is very handy for testing and debugging purposes.
On the top right-hand corner of your webhook screen (shown above), click on the Send test webhook button. This will pop open a dialog for you to select the event for which you want to send the test. See dialog below:
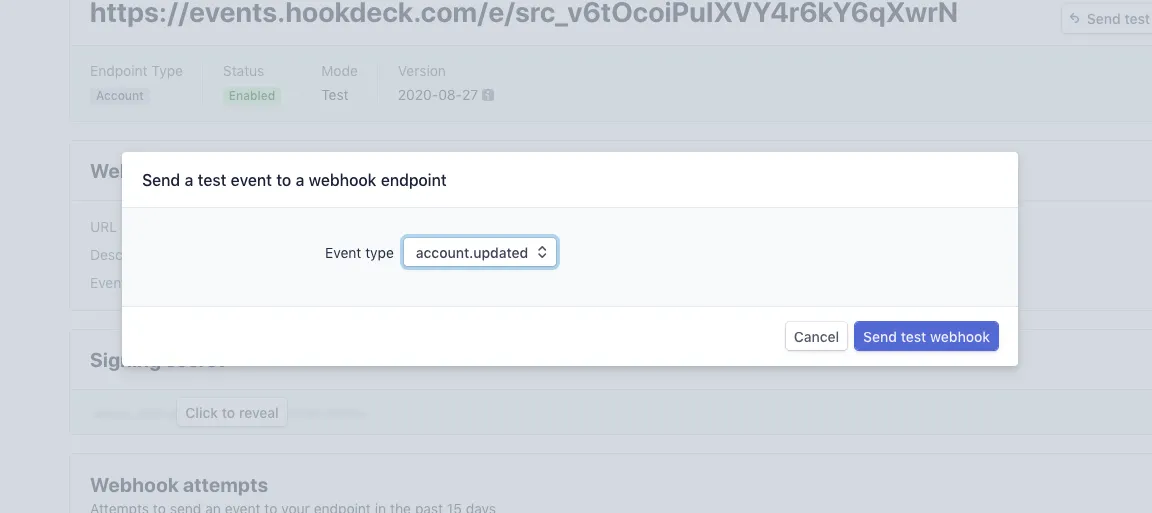
Make sure you select the account.updated event and click the Send test webhook button. This will trigger a webhook request to your webhook URL, which will be received at the endpoint you specified when creating the URL (i.e. /stripe-webhooks-endpoint).
Observe the terminal window where you ran the hookdeck listen 1337 command. You will see the webhook request printed to the terminal as shown below:
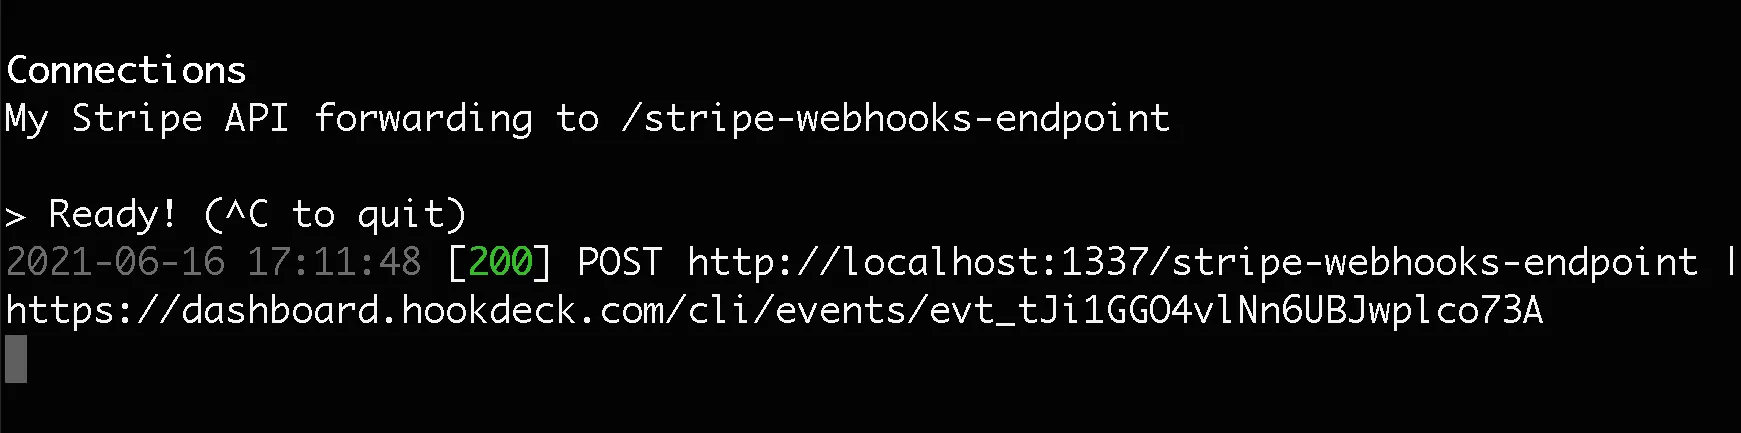
We are now successfully receiving our Stripe webhooks locally.
Debugging Stripe Webhooks
Inspecting webhook headers
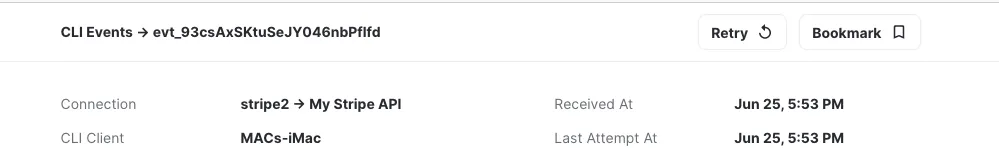
The last item in the information printed on the CLI for the received webhook is an endpoint for you to view details about the webhook request just received. Copy this URL and load it in your browser, and you will see an event details screen like the one below.
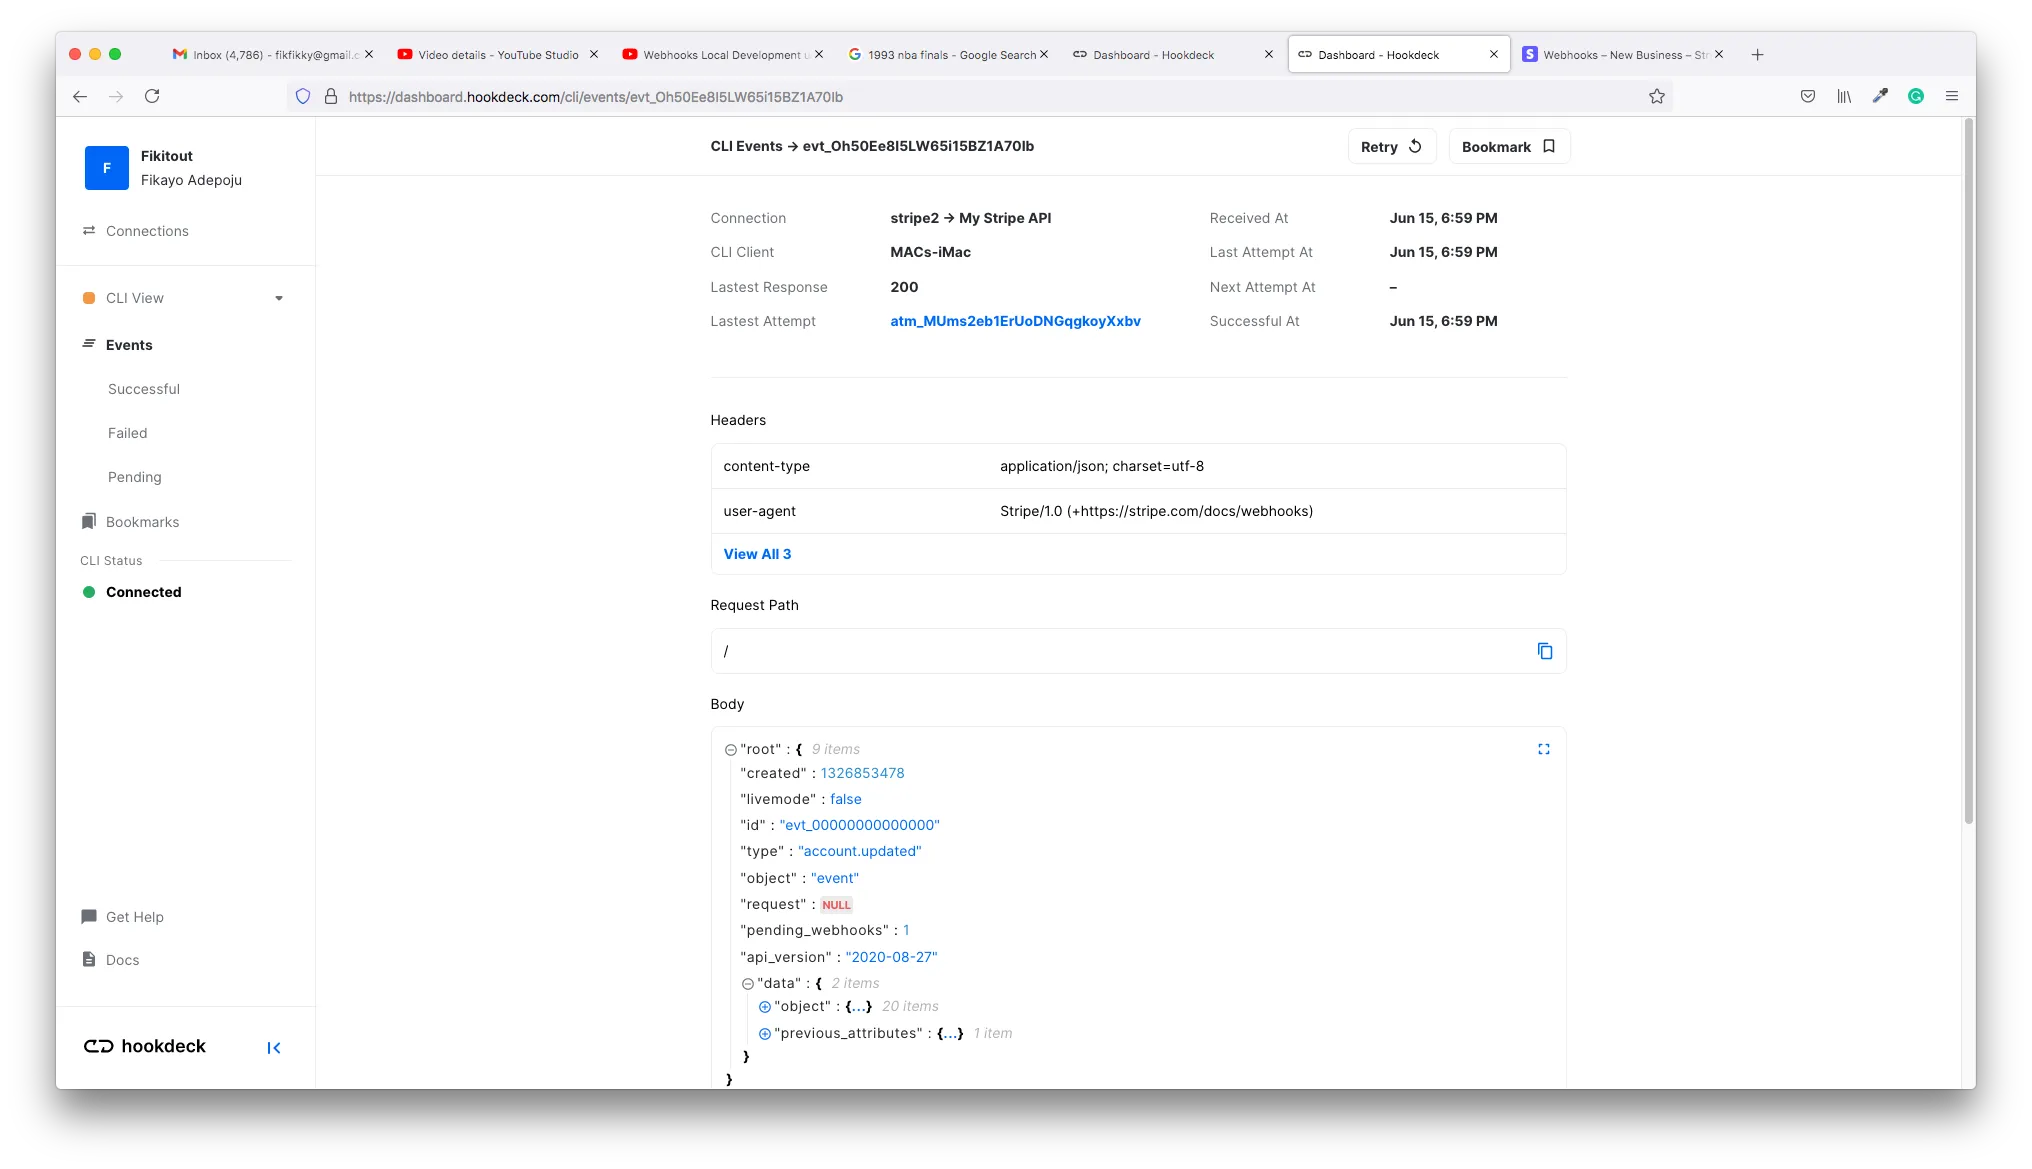
This screen contains a rich amount of details about the webhook you just received.
When working with webhooks, some of the important information sent in the webhook request is contained in the request headers. This can be authentication information like API tokens, cache information or custom headers that carry signatures to verify the source of the webhook.
If for some reason your webhooks are showing up in the terminal but your API endpoint is not receiving them, you want to check the headers to ensure that your endpoint is being authenticated.
The request headers for the received webhook are displayed in the Headers section of the event screen, as shown below:
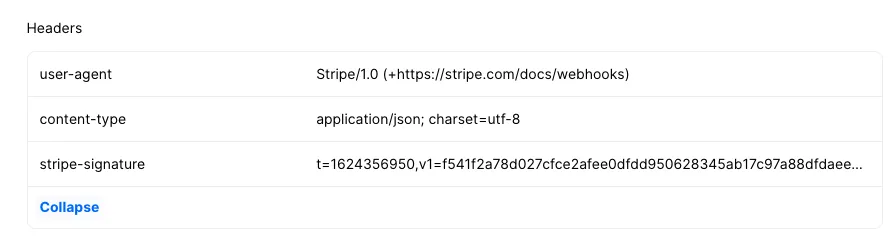
As seen in the above request, a Stripe signature is sent in the stripe-signature header. This signature allows you to verify that the webhooks are being sent by Stripe. You can verify Stripe signatures either using official Stripe libraries or by developing your own solution. Details on rolling your own verification system can be found here.
Inspecting webhook payload
Apart from being notified about an event that took place on a source application, another responsibility of webhooks is to transfer data from the source application to the destination application.
This is data you will often need to do some processing on your API endpoint based on the event that occurred. When debugging, you want to ensure that you're getting all the data required and in the right formats. Sometimes you will need to coerce into different data types to achieve the processing required at your end.
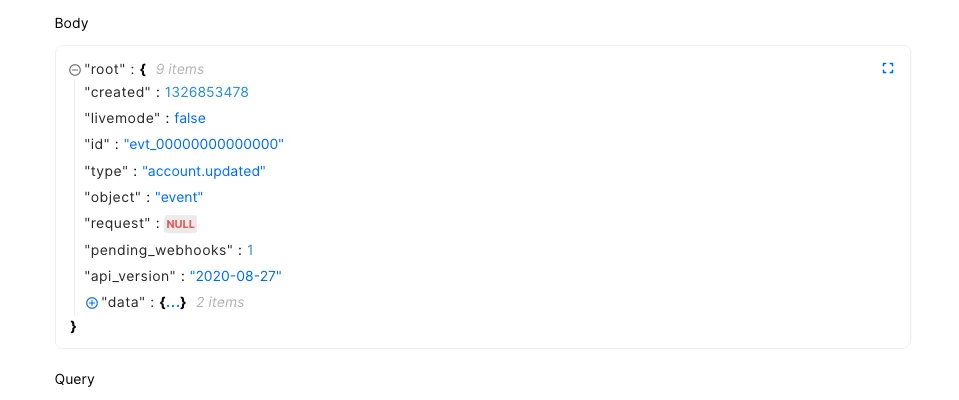
For example, when a user pays through your Stripe gateway, you will expect to receive the paid amount in a numeric format. Stripe might decide, for some reason, to send this value in string format. This can mess up the calculations or processing you need to do on your end, but if you inspect the value and discover that it was sent as a string, you would be able to include logic to coerce the value into a numeric format.
The event screen has a Body section where you can inspect all the parameters sent in the body of the request, as shown below:
Retrying webhooks
Debugging is a continuous cycle of test→ inspect → fix → test. When you fire a test webhook from Stripe and discover an issue or anomaly in your system, you inspect the request and your code to track the bug, fix it, then test again.
Oftentimes, when dealing with a bug, you may need to run tests multiple times. You don't want to be going back to your Stripe account to simulate a test over and over, as this can quickly become frustrating.
Don't worry, the Hookdeck CLI has you covered. There are two ways to retry an event.
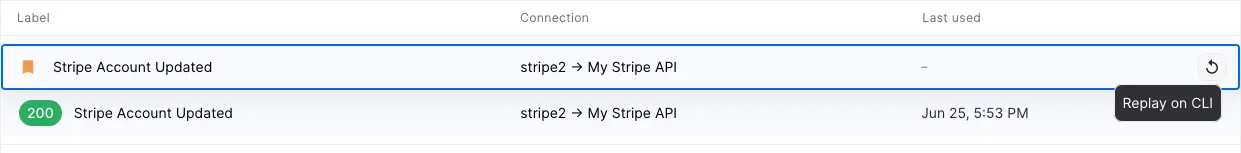
- Event Page: At the top right-hand corner there is a retry button, as shown below.
- Dashboard CLI View: The retry button is on the edge of the event.
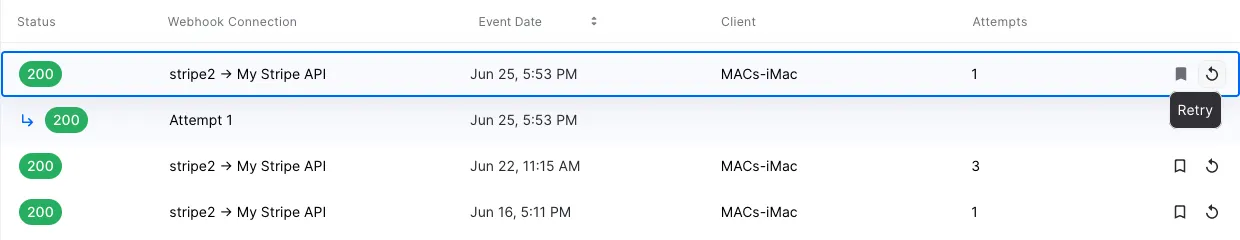
Click this button to retry the webhook request after making a fix, then inspect once again to see if the bug has cleared. This handy tool removes the stress of manually retrying the webhook request over and over.
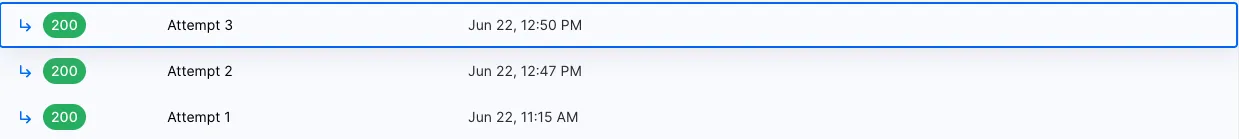
Attempt Response
When an event is retried, Hookdeck will generate a new attempt. It is useful to look at request response and server status.
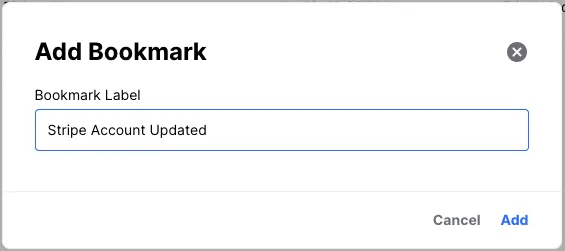
Bookmark a webhook
Having to manually trigger the event in Stripe or send a test notification can become cumbersome. You can __bookmark (save)__ a request that you can retry directly from the dashboard without having to go through Stripe.
Create a bookmark.
Replay event from the bookmark.\
Conclusion
^Conclusion
Debugging webhooks can be hard, but with the right tools you get a lot of support and that makes the process much less of a pain. In this tutorial, we have learned and demonstrated how to debug webhooks using the Hookdeck CLI and a Stripe webhooks case study. The study uses the account.update event on Stripe, but the principles learned here are easily transferrable when working with other webhook providers.
Happy coding!
Gain control over your webhooks
Try Hookdeck to handle your webhook security, observability, queuing, routing, and error recovery.