Metrics
The most critical webhook metrics to monitor are delivery success rate, retry rate, and end-to-end latency. Together, these three metrics tell you whether your webhook processing is healthy, whether failures are increasing, and whether your destinations are keeping up with incoming event volume. Hookdeck provides all of these as a free, built-in feature — updated in near real-time and exportable to your existing observability stack.
Metrics are a core feature of Hookdeck, providing insights into your webhooks and event-driven systems. They are available for free to all users. Most metrics are updated in near real-time, and some "stateful" metrics, such as Pending Attempts, are sampled at a rate of 5 seconds.
Key Metrics for Webhook Health
Delivery success rate
The percentage of events that are delivered successfully on the first attempt or after retries. A healthy webhook system should maintain a success rate above 99%. A declining success rate indicates problems with your destinations — slow responses, errors, or downtime. Track this per-destination to isolate which services are struggling. In Hookdeck, monitor the Events failure ratio on your Connection or Destination pages.
Retry rate
The ratio of retry attempts to total delivery attempts. A rising retry rate — even if events eventually succeed — signals that your destinations are under stress. Common causes include slow response times triggering timeouts, resource exhaustion, or bugs in handler code. Monitor retry rates alongside response latency to identify the root cause. See Retries for configuring retry policies.
Dead-letter queue (DLQ) volume
Events that exhaust all retry attempts represent permanent delivery failures. In Hookdeck, Issues serve as your dead-letter mechanism — tracking events that have failed all retries and alerting your team. A growing DLQ volume requires immediate investigation. Even a small number of permanently failed events may indicate data loss if left unaddressed.
End-to-end latency
The time from when Hookdeck receives a webhook to when your destination successfully processes it. Track the average, 95th percentile, and 99th percentile response latency on your Destination pages. Rising latency is often the first warning sign before failures begin — your destination is slowing down under load before it starts returning errors.
Duplicate rate
If your retry rate is high, your destinations are receiving duplicate deliveries. Monitor the Avg. attempts per event metric — values significantly above 1.0 indicate frequent retries and potential duplicate processing. Ensure your handlers implement idempotency to handle duplicates safely.
Alerting thresholds
Set up monitoring alerts to catch problems before they escalate:
- Delivery success rate below 99% — investigate destination health
- Retry rate above 5% — check destination response times and error patterns
- Queue depth (Pending Events) growing — your destination can't keep up with incoming volume; consider adjusting your delivery rate
- 95th percentile latency above 5 seconds — destination is approaching timeout territory
- Any Issue opened — an event has exhausted retries and needs manual attention
Use Metrics export to send these metrics to Datadog, New Relic, or Prometheus for custom dashboards and alerting rules.
Some metrics are essential to operating an event-driven system at scale. With metrics like Pending events (queue depth), Oldest pending event (backpressure), and Response latency, you can monitor the health of your system and take action when needed.
Other metrics like total Requests by Source or total Events by Connection can help you understand the usage of your system and identify potential issues.
Certain event metrics are only available in "point-in-time" instead of time-series data. We are working on moving those metrics to time-series. The "point-in-time" metrics are
Events with scheduled retries,Delayed events, andPaused events.
You can also export metrics to your observability platform (Datadog, New Relic, or Prometheus); see Metrics export below.
Accessing metrics
You can view and query metrics in the dashboard, from the CLI, or via the API. Each of the following tasks can be done in any of the three.
View metrics
Metrics information can be accessed in the dashboard, from the CLI, or via the API.
Open the Metrics page for an overview, or go to a specific Source, Connection, or Destination page to see metrics for that resource. Use the time range selector to change the period. Many charts offer an Explore option to drill into the underlying data.
Use the Hookdeck CLI to query metrics from the terminal. Subcommands include metrics events, metrics requests, metrics attempts, metrics queue-depth, metrics pending, metrics events-by-issue, and metrics transformations. All require a date range (--start, --end) and at least one --measures value. See the CLI metrics reference for full commands and use cases.
Use the Metrics API to fetch aggregated metrics programmatically. Endpoints include /metrics/requests, /metrics/events, and /metrics/attempts, with query parameters for time range, dimensions, and measures. See the Metrics API for all endpoints and parameters.
Query metrics for a date range
Get time-series metrics (e.g. event count, failure rate) for a specific period. The example below uses event metrics; the same pattern applies to requests, attempts, and other metric types.
- Open the Metrics page or a Source, Connection, or Destination page.
- Use the time range picker at the top to select the start and end date (and time if needed).
- The charts update to show metrics for that period. Use the chart menu () to explore or export.
hookdeck gateway metrics events \
  --start 2025-01-01T00:00:00Z --end 2025-01-31T23:59:59Z \
  --granularity 1d \
  --measures count,failed_count,error_rate
Replace the date range and add filters (e.g. --source-id, --connection-id) as needed. For all subcommands and options, see the CLI metrics reference.
{
  "data": [
    {
      "time_bucket": null,
      "dimensions": {},
      "metrics": {
        "count": 9,
        "successful_count": 7,
        "failed_count": 1,
        "scheduled_count": 0,
        "paused_count": 0,
        "error_rate": 11.11,
        "avg_attempts": 1.2222222222222223
      }
    }
  ],
  "metadata": {
    "granularity": null,
    "query_time_ms": 9,
    "row_count": 1,
    "row_limit": 1000000,
    "truncated": false
  }
}curl "https://api.hookdeck.com/2025-07-01/metrics/events?date_range%5Bstart%5D=2025-01-01T00:00:00Z&date_range%5Bend%5D=2025-01-31T23:59:59Z&measures%5B%5D=count&measures%5B%5D=failed_count&measures%5B%5D=error_rate" \
-H "Authorization: Bearer YOUR_API_KEY"
Use the query parameters to set the time range, granularity, and measures. For all metrics endpoints and parameters, see the Metrics API.
Viewing metrics
Metrics are displayed directly on the pages for individual resources, providing a granular view of your data.
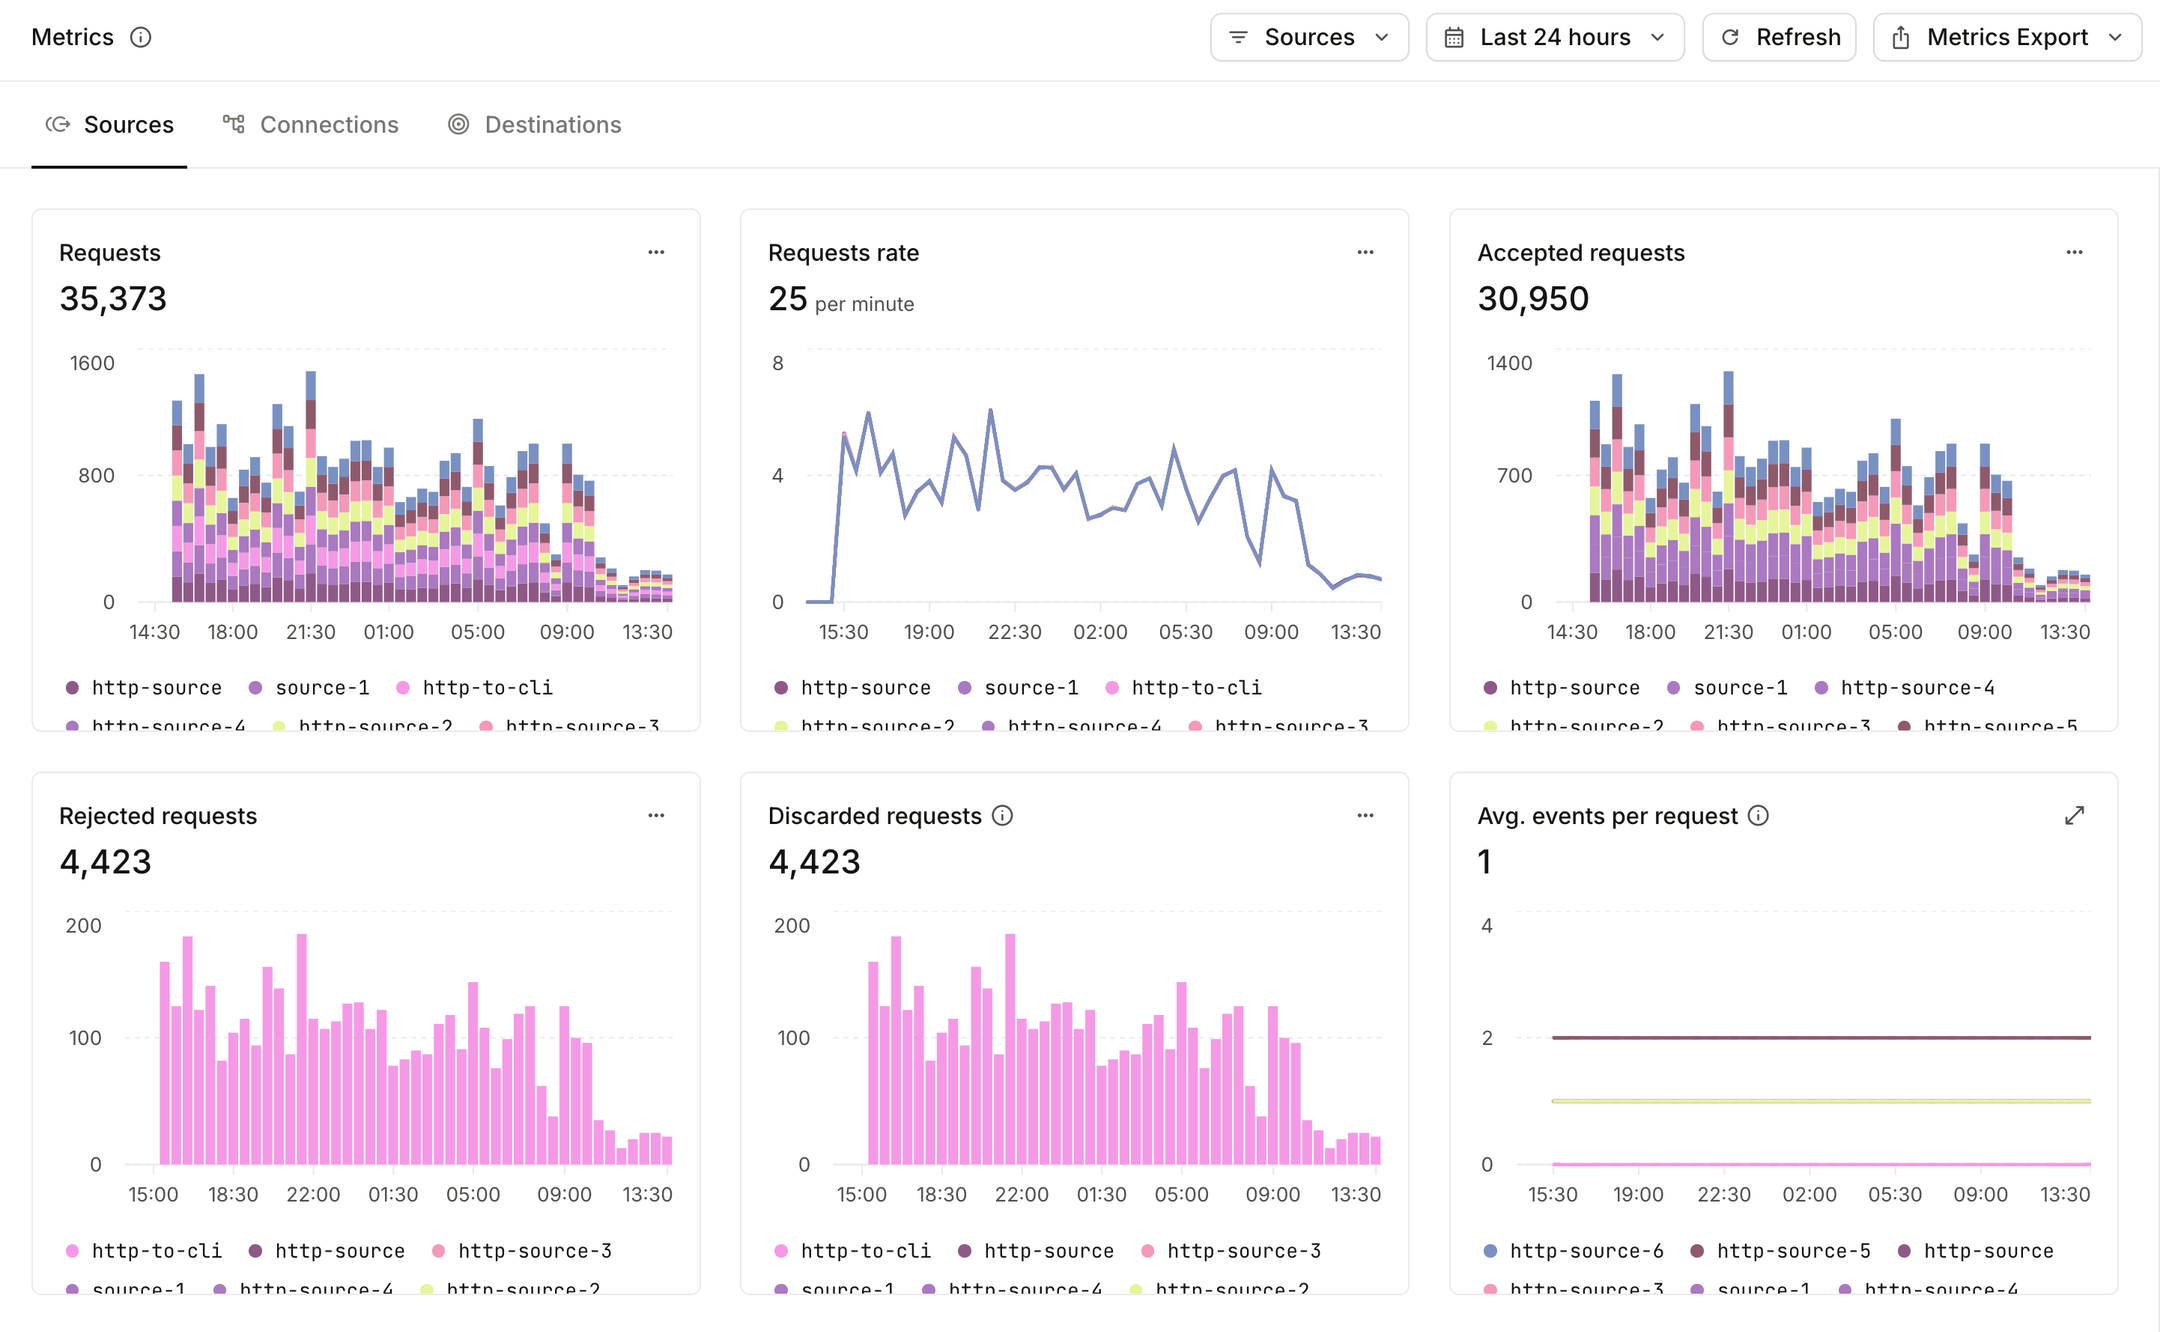
Sources
On a Source's page, you can find metrics related to the requests Hookdeck receives:
- Requests: The total number of requests received.
- Requests rate: The rate of requests received over time.
- Accepted requests: The total number of requests that were accepted.
- Rejected requests: The total number of requests that were rejected.
- Discarded requests: Requests that results in 0 events are considered discarded. This metric shows the number of discarded requests.
- Avg. events per second: Each request can create 0 or many events. This metric shows the average number of events per request.
- Avg. ignored events per request: The average number of requests that did not generate an event.
Connections
For each Connection, you can monitor the flow of events:
- Events: The total number (or rate) of events created.
- Events rate: The rate of events created over time.
- Successful events: The total number of successful events.
- Failed events: The total number of failed events.
- Events failure ratio: The ratio of total events to failed events.
- Avg. attempts per event: The average number of delivery attempts made per event.
- Events with scheduled retries: Events that have a future delivery attempt scheduled.
- Paused events: The total number of events that have been paused over time.
- Delayed events: The total number of events that are delayed over time.
Destinations
A Destination's page contains metrics for both events and attempts, grouped into subcategories. Metrics for destinations include:
Events
- Events: The total number of events sent to the destination.
- Events rate: The rate of events sent to the destination over time.
- Successful events: The total number of events that were successfully delivered.
- Failed events: The total number of events that failed to be delivered.
- Events failure ratio: The ratio of total events to failed events.
- Avg. attempts per event: The average number of delivery attempts made per event.
- Oldest pending attempt: The oldest attempt that is still pending delivery.
- Pending events: The total number of events that are still pending delivery to the destination.
Attempts
- Delivered attempts: Number of attempts that were attempted to be delivered to the destination.
- Attempts delivery rate: The rate of delivery attempts that were successful over time.
- Successful attempts: The total number of delivery attempts that were successful.
- Failed attempts: The total number of delivery attempts that failed.
- Attempts failure rate: The rate at which delivery attempt errors to this destination are occurring.
- Avg. response latency: The average response latency of the destination.
- 95th response latency: The 95th percentile of response latency for the destination.
- 99th response latency: The 99th percentile of response latency for the destination.
- Max. response latency: The maximum response latency recorded for the destination.
Exploring metrics
Many charts in the dashboard feature an "Explore" option under the button. Clicking it opens the relevant data page (Requests or Events) with filters applied to match the chart, so you can investigate spikes or anomalies. To apply similar filters when querying from the terminal or programmatically, use the CLI metrics reference or Metrics API with the appropriate dimensions and time range.
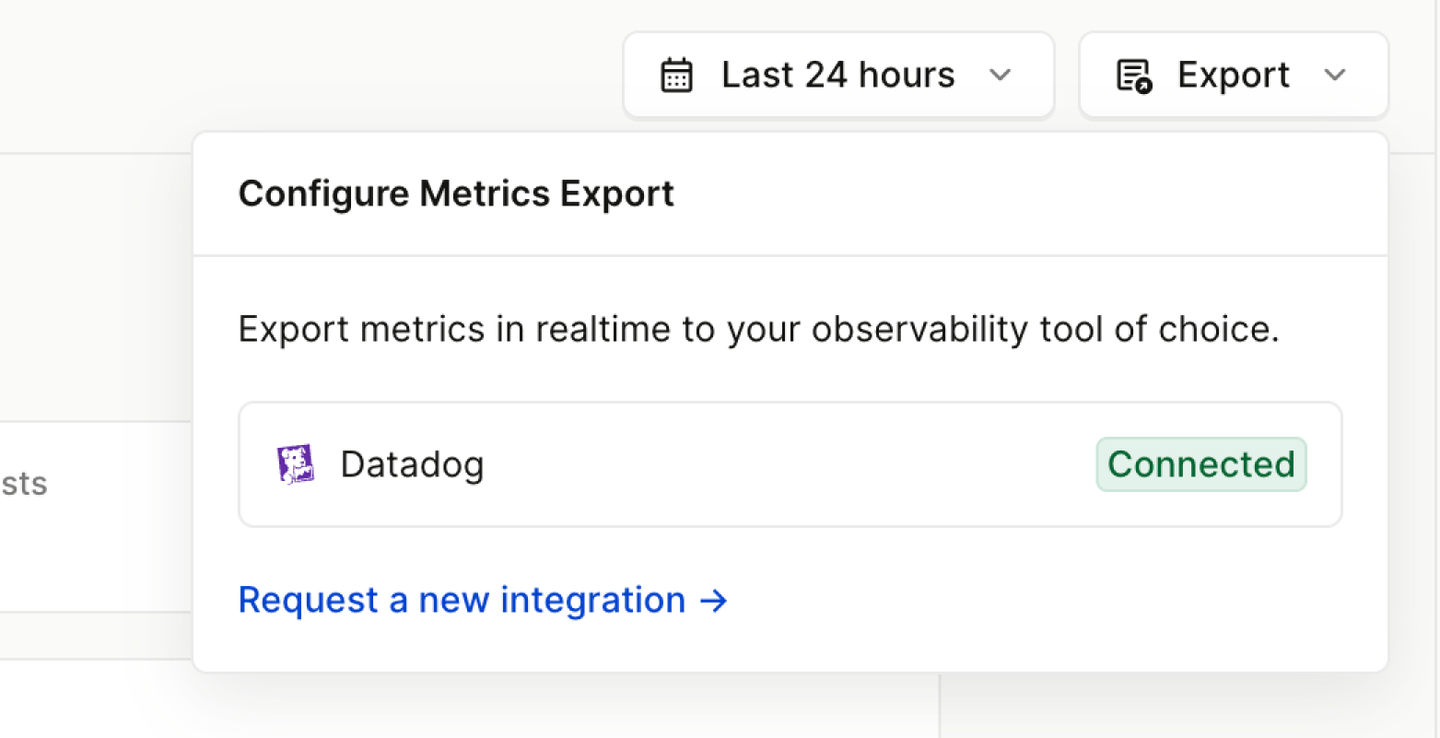
Metrics export
Metrics export allows you to access your Hookdeck project metrics in your own observability platform. We currently support exporting to Datadog, New Relic, and Prometheus.
Exporting metrics is also an opportunity to support custom alerts and dashboards. For example, you can create an alert when the Pending Attempts metric is above a certain threshold.
Exporting to Datadog
The Datadog integrations support exporting to Datadog "Metrics" using your own Datadog API key. To configure the integration:
- Go to the project integrations page
- Select on the Datadog integration.
- Follow the instructions to generate a new API key and provide your key.
- Within a few minutes the Metrics data will start appearing in your Datadog account.
Datadog Dashboard template
We have created a dashboard template that you can use to get started with Datadog. The dashboard is pre-configured with the metrics that we think are most useful.
To use the dashboard template:
- Download
datadog/template.jsonand upload it to Datadog - Go to the dashboards list in your Datadog account
- Select and create the dashboard
- Select , , and import the Hookdeck dashboard template
Metric tags
Each metric is tagged with the following tags:
name: The name of the metricsource: The source of the metric. This is alwayshookdeckproject: The name of the projectorganization: The name of the organization
Additionally, each metric is tagged with the name of the associated resource (e.g., source, connection, or destination).
Renaming a source, connection or destination will cause the metric to be tagged with the new name. This will cause a "break" in the metric history as historical data will be tagged with the old name.
Metric names
Each metric name is prefixed with hookdeck.. The complete list of metrics can be found in the metrics Datadog history page.
Exporting to Prometheus
The Prometheus integration allows you to expose Hookdeck metrics in Prometheus format via a dedicated API endpoint that Prometheus can scrape. This enables you to monitor your webhook infrastructure using your existing Prometheus and Grafana setup.
To configure the integration:
- Go to the project integrations page
- Select on the Prometheus integration
- Enable the integration to activate the metrics endpoint
- Configure your Prometheus server to scrape the metrics endpoint (see configuration below)
Prometheus Configuration
Add the following job to your prometheus.yml configuration file:
scrape_configs:
  - job_name: "hookdeck"
    scrape_interval: 30s
    metrics_path: "/metrics/prometheus"
    scheme: https
    bearer_token: "YOUR_HOOKDECK_API_KEY"
    static_configs:
      - targets: ["api.hookdeck.com"]
Replace YOUR_HOOKDECK_API_KEY with your Hookdeck API key, which you can find in your Hookdeck project secrets.
Grafana Dashboard Template
We have created a dashboard template to help you get started with visualizing your Hookdeck metrics.
To import the dashboard:
- Download the
/prometheus/template.jsonfile - Open your Grafana instance and navigate to
- Click →
- Upload the JSON file or paste its contents
- Select your Prometheus data source
- Click
The dashboard includes panels for:
- Request rates and totals (accepted, rejected, total)
- Event processing metrics (successful, failed, ignored)
- Delivery attempt statistics
- Queue depth (Pending Events) monitoring
- Response latency averages
- Source and destination breakdowns
Available Metrics
All metrics are exposed in Prometheus exposition format with the prefix hookdeck_. The following metrics are available:
Counter Metrics
hookdeck_requests_total- Total number of requests received- Labels: status (total, accepted, rejected)
hookdeck_events_total- Total number of events processed- Labels: status (total, successful, failed, ignored)
hookdeck_attempts_total- Total number of delivery attempts- Labels: status (total, delivered, failed)
Gauge Metrics
hookdeck_queue_depth- Current queue depth (pending events) per destinationhookdeck_avg_response_latency_ms- Average response latency in milliseconds
Metric Labels
Each metric is labeled with the following standard labels:
team_id- The unique identifier of the teamteam_name- The name of the teamorganization- The name of the organization
Additionally, metrics include resource-specific labels:
source_idandsource_name- For request metricswebhook_idandconnection_name- For event metricsdestination_idanddestination_name- For attempt and queue metrics
Update Frequency
Metrics are calculated and updated based on your Prometheus scrape interval. We recommend a scrape interval of 30 seconds for optimal balance between data freshness and performance.
Troubleshooting
If metrics are not appearing:
- Verify the Prometheus integration is enabled in your Hookdeck project settings
- Check that your API key is valid and has the necessary permissions
- Ensure your Prometheus server can reach api.hookdeck.com
- Verify the bearer token is correctly configured in your Prometheus configuration
- Check Prometheus targets page (/targets) to see if the scrape is successful
Exporting to New Relic
The New Relic integration allows you to export Hookdeck metrics directly to your New Relic account using the New Relic Metrics API. This enables you to monitor your webhook infrastructure alongside your other application metrics.
To configure the integration:
Get Your New Relic Credentials
API Key (License Key):
- Navigate to your New Relic Dashboard
- Click on your user menu in the top right corner
- Select API Keys
- Click Create a key
- Important: Select Ingest - License as the key type (not User API key)
- Copy the generated License Key
Account ID:
- Go to your New Relic homepage
- Find your Account ID in the URL (e.g.,
https://one.newrelic.com/accounts/YOUR_ACCOUNT_ID/...) - Alternatively, check the account switcher in the top navigation
Configure the New Relic Integration in Hookdeck
- Go to the project integrations page in the Hookdeck Dashboard
- Select on the New Relic integration
- Enter your License Key and Account ID
- Within a few minutes, metrics data will start appearing in your New Relic account
Available Metrics
All metrics are sent to New Relic with the prefix hookdeck.. The following metrics are available:
Counter Metrics
hookdeck.requests.total- Total number of requests received- Attributes: status (total, accepted, rejected)
hookdeck.events.total- Total number of events processed- Attributes: status (total, successful, failed, ignored)
hookdeck.attempts.total- Total number of delivery attempts- Attributes: status (total, delivered, failed)
Gauge Metrics
hookdeck.queue.depth- Current queue depth (pending events) per destinationhookdeck.response.latency.avg- Average response latency in milliseconds
Metric Attributes
Each metric includes the following attributes:
team_id- The unique identifier of the teamteam_name- The name of the teamorganization- The name of the organization
Additionally, metrics include resource-specific attributes:
source_idandsource_name- For request metricswebhook_idandconnection_name- For event metricsdestination_idanddestination_name- For attempt and queue metrics
Renaming a source, connection or destination will cause the metric to be tagged with the new name. This will cause a "break" in the metric history as historical data will be tagged with the old name.
Troubleshooting
If metrics are not appearing in New Relic:
- Verify the New Relic integration is enabled in your Hookdeck project settings
- Ensure you're using an Ingest - License key (not a User API key)
- Verify your Account ID is correct
- Check that your License Key has not expired
- Allow a few minutes for metrics to start appearing after initial setup
Requesting a new integration
We plan on supporting most popular observability platforms. If you would like to request a new integration, please contact us via the live chat, or by email at info@hookdeck.com
Frequently Asked Questions
What webhook metrics should I monitor?
At minimum, monitor delivery success rate (are events being delivered?), retry rate (are destinations struggling?), and response latency (are destinations slowing down?). Queue depth (pending events) is also critical for detecting backpressure. See Key Metrics for Webhook Health above for detailed guidance.
How do I set up webhook delivery alerting?
Use Hookdeck's Issues & Notifications for built-in alerting on delivery failures and exhausted retries. For custom alerting thresholds (e.g., alert when retry rate exceeds 5%), export metrics to Datadog, New Relic, or Prometheus and configure alerts in your observability platform.
What is a healthy webhook delivery success rate?
A healthy webhook system should maintain a delivery success rate above 99%. Rates between 95-99% indicate intermittent issues worth investigating. Rates below 95% suggest a systemic problem — check destination health, response times, and error patterns in your Metrics dashboard.
How do I export webhook metrics to my monitoring stack?
Hookdeck supports native metrics export to Datadog, Prometheus/Grafana, and New Relic. Configure the integration in your project's integrations page. Pre-built dashboard templates are available for each platform to get you started quickly.